System administration requires simple, lightweight, and reliable tools to monitor real-time server activity. Among them, nload has become a popular choice: a command-line viewer that graphically displays incoming and outgoing network traffic, with detailed bandwidth usage statistics.
This article explains what nload is, how it works, its advantages over other network monitors, and the steps to install it on the most commonly used Linux distributions.
What is nload?
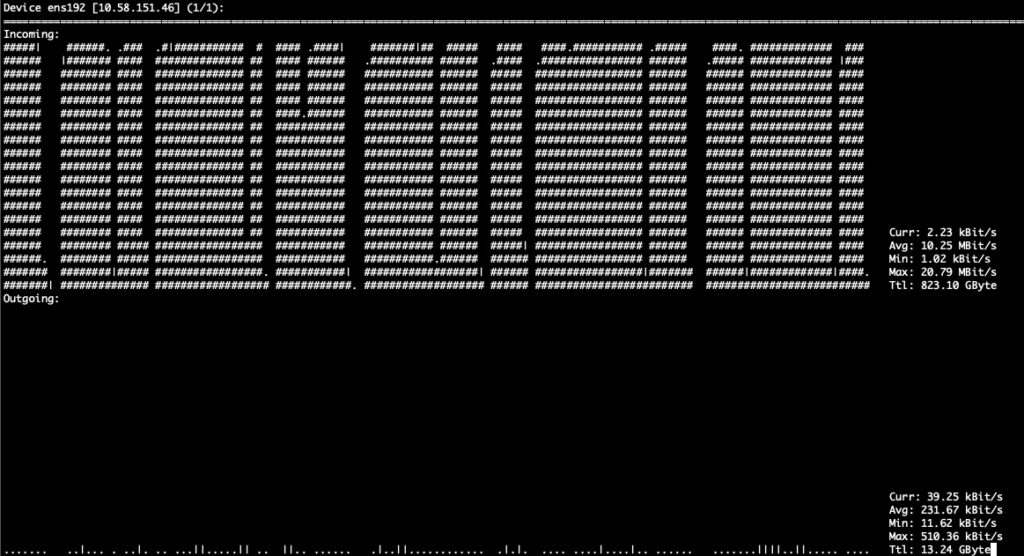
nload is a command-line utility that allows real-time network traffic monitoring. Its ncurses-based interface displays two separate graphs:
- Top graph: inbound traffic (download).
- Bottom graph: outbound traffic (upload).
Additionally, it provides numerical statistics for:
- Current traffic.
- Average (Average).
- Minimum (Min) and maximum (Max).
- Total transferred during the session.

This makes it an ideal tool for system administrators who need to quickly assess network load on a server, especially in environments without a graphical interface.
Advantages of using nload
- Lightweight: consumes minimal system resources.
- Clear interface: displays traffic in graphs and numerical values.
- Real-time updates: refreshes information second by second.
- Compatibility: works on all modern Linux distributions.
- Simplicity: requires no complex configuration or external dependencies.
Although it does not provide per-process breakdowns like iftop or bmon, its simplicity makes it perfect for supervising production servers or remote equipment.
Installing nload on Linux distributions
On Debian / Ubuntu
The official repositories include the package, so just run:
sudo apt update
sudo apt install nload -y
To uninstall:
sudo apt remove nload -y
On CentOS / RHEL / AlmaLinux / Rocky Linux
For RHEL-based systems, nload is available in the EPEL repositories (Extra Packages for Enterprise Linux).
- Enable EPEL (for RHEL 8 / CentOS 8 / derivatives):
sudo dnf install epel-release -y
- Install nload:
sudo dnf install nload -y
On older versions with yum:
sudo yum install epel-release -y
sudo yum install nload -y
On Fedora
Fedora includes nload in the main repositories:
sudo dnf install nload -y
On Arch Linux / Manjaro
Available in the community repository:
sudo pacman -S nload
On openSUSE
sudo zypper install nload
Optional: Installing from source code
If your distribution does not have a package or you need the latest version:
sudo apt install build-essential libncurses5-dev libncursesw5-dev git -y
git clone https://github.com/rolandriegel/nload.git
cd nload
make
sudo make install
Using nload
Once installed, simply run:
nload
By default, it shows the main network interface (usually eth0, ensX, or wlan0). If your server has multiple interfaces, you can specify which to monitor:
nload eth0
To switch between available interfaces, press the → (right arrow) key, and to go back, ←.
Useful options
-m→ display all interfaces on one screen.-t 500→ set refresh interval in milliseconds (500 ms in this example).-u M→ change unit to MB/s instead of Kbit/s.
Example:
nload -m -u M
Conclusion
nload is an essential tool for any Linux system administrator needing to monitor network traffic in real-time in a lightweight, straightforward way. Installing it is simple on most distributions, and its learning curve is nearly zero.
While it does not replace more advanced monitors like iftop or vnstat, its visual clarity makes it ideal for quickly detecting network bottlenecks or verifying server activity.
Frequently Asked Questions (FAQ)
Can I use nload on servers without a graphical interface?
Yes. nload runs entirely in the terminal, making it perfect for remote SSH-managed servers.
What is the difference between nload and iftop?
nload displays aggregated traffic per interface with graphs and stats. iftop, on the other hand, breaks down individual connections and processes.
Does nload consume many resources in production?
No, it is extremely lightweight. CPU and memory usage are negligible compared to other real-time monitors.
Can I export nload data for later analysis?
nload does not save historical logs. For reports and prolonged storage, tools like vnstat or collectd are recommended.

